


Power Spot market sees rise in demand and prices in August 2014
667 participants traded in the spot market on an average daily basis in the month of August 2014
September 04, 2014. By Moulin

The electricity traded in the spot market at Indian Energy Exchange (IEX) increased in the month of August to 2.5 BUs (Billion kWh), almost 8% higher than 2.3 BUs traded in the previous month and 7% higher over 2.3 BUs traded in the same month last year. An average of 80 MUs was traded on a daily basis, again an 8% increase over 74 MUs traded last month.
As regards the demand and supply of power, the spot market received purchase bids worth 4.72 BUs while the Sell bids were only 3.01 BUs, clearly indicating that demand surpassed supply this month. Consequently, the average market clearing price (MCP) for the month went up to Rs. 4.49 per unit, up by 19% from Rs. 3.76 per unit in July’14.
The increase in demand and the consequent rise price of power could be attributed to a couple of reasons i.e. scanty rainfall and consequent reduction in hydro generation, coal and gas shortages and increase of agricultural load in some States.
The inter-state transmission congestion was also lower over last month as about 200 MUs could not be traded this month as compared to 223 MUs lost in July.
Volumes:
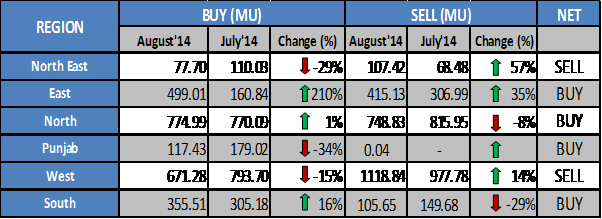
The Eastern States saw the demand tripling over last month as more than 499 MUswere bought as compared to only 110 MUs last month. The Southern States bought almost 356 MUs of power, 16% more as compared to July.
On the sell side - the Western States sold highest amount of power close to 1.12 BUs this month while the North-Eastern States sold almost 108 MUs, almost 57% more over last month.
The region-wise buy and sell volume trend is represented in the ensuing table:
Prices:
In North, North-East and East, the average area price was Rs. 4.19 per unit, almost 25% higher over July and in West the average area price was Rs. 4.16 per unit, 29% higher over July’14.
Prices in the South are usually higher over the prices in other States due to persisting transmission constraints. In August, the Southern states saw a slight increase in area prices.
The table below compares the average Area Clearing Price (ACP) in August vis-à-vis prices in July.
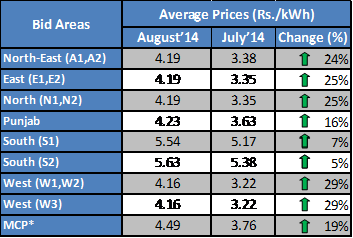
*MCP (Market Clearing Price) refers to the price discovered before accounting for congestion in the transmission corridor
*ACP (Area Clearing Price) refers to the bid area prices discovered after accounting for congestion in the transmission corridor
Transmission Congestion Analysis:
- The flow of power from Eastern to Southern States remained constrained 71.7% of time.
- The flow of power from Western to Southern States remained constrained 73.8% time.
- In Southern region, S1 (Andhra Pradesh, Telangana and Karnataka) – S2 (Tamil Nadu and Kerala) corridor was congested 24.2% of time through the month
Overall almost 200 MUs could not be traded this month due to inter-state transmission corridor congestion. However, there was no market split for the delivery dates of 28thand 29th August, 2014 for all time-blocks in the day. This was last observed almost three years back on 7 November 2011.
Participation:
This month 667 participants traded in the spot market on an average daily basis. The highest participation was on 7 August, when 795 participants traded in the spot market.


please contact: contact@energetica-india.net.


Archana Bhatnagar
Director, Market and Project Development, South Asia

Renewables Will Become the Backbone of India’s Grid, Says Wärtsilä’s Archana Bhatnagar
Gadhadar Reddy
Co-Founder & CEO

NoPo' Gadhadar Reddy Explains India's Deep-Tech Opportunity in Single-Walled Carbon Nanotubes
Samir Mehta
CEO

AI-enabled Manufacturing Will Reshape Indian Solar Production in Next 5 Years: Zuvay CEO
Sanskar Modi
Founder and CEO

Decentralised Energy Solutions to Drive India’s EV Revolution: Sanskar Modi of SunCharge Motors
Shantanu Upasani
Head of Construction

Hybrid Projects Need Smarter Execution, Explains Shantanu Upasani, Head of Construction, ENGIE